Despite using the terms interchangeably, many don’t realize that “precision” and “accuracy” are two entirely different things. Accuracy is defined as “the degree to which the result of a measurement, calculation, or specification conforms to the correct value or a standard.” In other words, an accurate measurement is one that provides a true answer and the correct measurement. Precision, on the other hand, has little to do with truth or correctness. Precision is defined as “refinement in a measurement, calculation, or specification, especially as represented by the number of digits given.” So, increasing the precision of a measurement does not ensure that the measurement becomes more accurate, nor does an accurate measurement necessarily have to be precise.
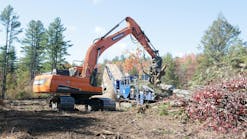
This distinction is of vital importance in the measurements of projected earthwork volumes needed to properly cost out an earthmoving project. Earthwork contractors live and die based on these measurements, especially in a highly competitive market where profit margins can be razor thin. And this is why earthwork volume estimating and material takeoff calculating software is so vital. No general or earthwork contractor can hope to respond quickly and effectively to a project’s request for proposal, and so these tools are widely used.
But what separates a good software estimating package from a great one? What improvements to this family of software have helped end-users increase efficiency and productivity? And what about after the project has started, how can this software track progress and guide field operations? What does the software do after the contractor wins a bid and starts work on the project? And how do you get both accuracy and precision? The answer to all of the above is mathematics. There are any number of mathematical methods for determining the areas and volumes of irregular shapes.
The Mathematics of Area Estimating
The first technique is the Triangular Area Method. Any regular or irregular area can be represented by a series of triangles. A triangular shaped area can, of course, be represented by a single triangle. A four-sided area (square, rectangle, trapezoid, diamond or rhombus) can be defined as a pair of adjacent triangles joined at a mutual hypotenuse. Any other regular polygon of five sides or more can also be represented by a series of triangles (the simplest configuration resembling pie slices meeting at a point in the center of the polygon, though other triangle configurations are always possible). And finally, irregular polygons can also be defined as a series of irregular triangles sharing common sides. Even areas with curved boundaries can be reasonably approximated as a series of irregular triangles, with the accuracy of the subsequent measurement increasing as the size of each triangle decreases to better fit the area’s curved boundary.
So once the area has been defined by its triangles, how can the areas of each triangle be calculated? The first step is to determine the northing and easting locations of each of the three points of the triangle. Once these have been determined, the lengths of each side of the triangle can be calculated from the Pythagorean theorem:
L = sqrt [(N1 – N2)2 + (E1 – E2)2]
Where:
N1 and N2 = the northings of the two endpoints of the side
E1 and E2 = the eastings of the two endpoints of the side
L = the calculated length of the side
After the length of each side of the triangle is determined, the area of the triangle is calculated as follows:
A = sqrt [s * (s – La) * (s – Lb) * (s – Lc)]
Where:
s = the average of the side lengths: (La + Lb + Lc) / 2
La, Lb, Lc = the lengths of the three sides of the triangle
A = the calculated area of the triangle
The total flat plane area of the site can then be calculated by adding the sum of the areas of all of the individual triangles used to define the site area. Note that this method gives a flat plane only and does not take into account changes in surface elevation resulting from changes in slope and elevation across the site.
In addition to calculating an area as a series of triangles, the area of a site can be calculated from a series of parallel strips by the Length Interval Method. This method is usually reserved for highly irregular areas that don’t easily render down to a series of triangles. Basically, the site area is divided into a series of parallel lines running in the same direction (north to south, east to west) that extend from one side of the site area to the other. The lines form the sides of consecutive, parallel strips of land. Once these strips are established, their individual areas can be calculated as follows:
A = D * [(L1 + L2) / 2]
Where:
L1, L2 = lengths of the adjacent intervals
D = distance between intervals along the baseline
A = the calculated area of the parallel strip
Again, as with the triangular area method, the length interval method only gives flat plane areas. The strips and parallel boundary lines do not follow the actual surface terrain of the site and, as such, do not include the additional surface area produced by variable terrain.
To determine the surface area in three dimensions with each vertex of the triangle having a different elevation (Z), as well as their northings and eastings (x and y), requires the use of Vectors and Matrix Algebra. The areas of flat triangles are also derived from matrices:

Which resolves as follows:
A = (1/2) * (-x2y1 + x3y1 + x1y2 – x3y2 – x1y3 + x2y3).
A three-dimensional triangular area requires an expanded matrix with math derived from the Pythagorean theorem:

Such calculations, especially over large sites consisting of many triangle shaped areas in three dimensions, would be best performed by a computer. Fortunately, most earthwork estimating software and AutoCAD systems includes this function.

The simplest method of volume estimation is the Depth Area Method. This method is suitable for regular sites with smooth and regular surfaces, both existing and proposed, separated by a consistent depth or fill height across the entire site. This approach involves multiplying the area of the site by the consistent depth of excavation or height of soil placement. Reasonably good estimates for soil volumes can be achieved by using the average depth or fill height if these vary somewhat across the site. This approach only works on sites where the surface finished grades (either cut or fill) will run parallel with existing grades. Furthermore, the edge of the excavation will have to be a vertical or near vertical cut instead of sloping down from the edge of the excavation to the flat bottom of the excavation floor (fill placement always requires the construction of stable slope instead of near vertical cliffsides). The Depth Area Method is calculated as follows:
V = T * A
Where:
A = surficial slope area
T = thickness of fill placement or depth of cut
V = the calculated volume

These grid points are applied to both the existing and proposed surfaces. The elevation of each point on its respective surface is determined from the existing topography and proposed grading plan. The difference in elevation is measured between the two surfaces at each of the four corners of every grid square. In effect, it resolves the volume of the proposed earthwork into a series of square columns of different heights and depths (like a three-dimensional version of the surface areas strips used in the Length Interval Method). The average depth or height of these soil columns is determined by averaging the elevation differences at each corner of the grid square. The average elevation difference is then multiplied by the area of the grid square to determine the volume of the soil column:
V = [(D1 + D2 + D3 + D4) / 4] * A
Where:
A = area of the grid square
D1, D2, D3, D4 = depth of cut/fill at each grid corner
V = the calculated volume
Instead of vertical grids, horizontal slices can be used to determine volumes by means of the End Area Method. The slices are in parallel and traverse the site horizontally, but each slice creates a vertical cross-section through the soil volume. As with the vertical columns of the Grid Method, the spacing of the slices usually depends on the size of the site being analyzed. A smaller site of only a few acres would require slices at 10 to 20 feet intervals to be sufficiently accurate. By contrast, a larger site of hundreds of acres could be adequately measured by slices at 100 feet intervals. Each slice extends perpendicularly from a baseline running the full extent of the site, with each slice also extending the full extent of the site in alignment with its own axis.
The cross sections created by each slice alignment can be drawn manually, but it is far more efficient and accurate to have them drawn by an AutoCAD program. The area of each cross section is determined by the same method (triangular areas) used to determine the plane areas of property boundaries and site limits. Once the area of each parallel cross section is determined, then it can be used to calculate the average cross-sectional area of the slice through the soil volume defined by the cross-sections. The average cross-sectional area is then multiplied by the interval distance between the parallel cross sections to determine the volume of the slice. By adding up all of the volumes of the slices cut through the soil volume, a total volume estimate can be calculated:
V = L * [(A1 + A2) / 2]
Where:
A = areas of the adjacent cross-sections
L = distance between cross section along the baseline
V = the calculated volume
A version of this method is the Prismoidal Formula, where an additional cross-section area is calculated for the midpoint between the two cross-section areas defining the volume slice. This is not the average of the two areas but instead is calculated separately. This method is typically used for areas with highly irregular surfaces and is a way of increasing the accuracy of the volume estimate, which would be lost by a simple averaging of the cross-sectional areas.
The two-dimensional area calculation methods can also be used to determine volumes by means of the Contour Area Method. This technique utilizes the contour elevation lines generated for topographic maps and grading plans. Each elevation contour’s flat plane area is calculated as if it was a property line or site limit area. When each contour area is determined, average areas can be calculated between vertically adjacent elevations. This average is multiplied by the elevation difference between the two contour elevations and will give the estimated volume for the horizontal slice through the soil volume.
Lastly, the most sophisticated and accurate methods of volume estimation are the Triangulated Irregular Network (TIN) and Digital Terrain Model (DTM) methods. This is a combined approach where triangularly shaped TIN files are created in AutoCAD to simulate a closely as possible the true terrain surface. A more complicated, irregular surface will require a large number of smaller TIN surfaces and associated files where a simple flat surface only needs a few larger TIN surfaces. By combining individual TIN surfaces, the AutoCAD system can create a complex and highly accurate DTM of the surface. These DTMs allow for direct volume measurements between fixed elevations, flat surfaces, individual soil strata making up the site’s hydro-stratigraphy, or other equally complex DTMs. The required volume calculations are beyond the scope of manual computation and have to be performed by a computer.
Accuracy and Sources of Error
With all of these methods available, what could go wrong? First off, nothing is 100% accurate. Nor is perfection necessarily desirable. If a map were a perfect representation of the terrain it would actually be the terrain—and be useless as a map. Yet an estimator still has to take into account the possible sources of error that would reduce the overall accuracy of his estimates to unacceptable levels.
The first step in maximizing accuracy is a physical walkover of the site. Guided by the proposed grading plans and maps of the existing topography, the estimator needs to completely walk the site to determine all of the myriad features that never show up on even the best plans. Survey errors, changes to the site since the plans were prepared, and other features that could affect the volume estimate need to be determined. And that can only be done on foot. Even in the age of drones, GPS, and LIDAR, there is no substitute for good, old-fashioned, eyes-on site reconnaissance.
Neither should the estimator take the survey information at face value or for granted. Every site survey should ideally be based on at least one third-order benchmark to anchor the location and elevation of each survey shot. Too often, site surveys are based on local benchmarks that utilize objects such as valve stems or manhole lids to provide derived or relative benchmarks. Relative benchmarks are assigned origin northings and eastings (0+00 north and 0+00 east) and some fixed elevation (1,000.00 feet, e.g.). All other measurements are made in relation to these relative values. Later, once a proper benchmark is discovered or established, these measurements can be translated horizontally or vertically into a real-world survey system. Until then, it remains a source of potential error.
Property records are an important source of non-survey site information. In addition to the physical reconnaissance of the site, the estimator should do a thorough paper search of site records pertaining to anything that could affect the proposed grading plans or impact the final volume estimate. These include boring logs, buried utilities, karst topography, existing wetlands, previous waste disposal or dumping operations, etc.
Then there are simple math errors and measurement mistakes. Even the most experienced engineer or contractor can make mistakes on paper or in the field that in retrospect should have been obvious. People are not perfect, and that is why it is called “human error.” And even if each calculation is done perfectly, there are other sources of error that can be avoided with proper judgment.
The trouble with error is that it is cumulative. Being only 95% correct over five iterations yields a final answer that is only 77% correct. Furthermore, some errors are built into the system. For example, aerial topographic maps are only accurate to within one half of the elevation contour used to create the map. In other words, an aerial map utilizing 10 feet contour intervals could be off by plus or minus 5 feet.
And then there are the errors that have nothing to do with the volume estimate. When excavating soil, the amount that goes loose into the haul truck for removal could be 20% more than the bank soil when it was in the ground. Depending on the construction specifications, placing fill could result in an embankment volume only 75% of the loose volume of soil in the haul truck.
Long story short: error can never be eliminated, but it can be greatly minimized through thorough research and accurate analysis.

Enter GPS systems mated with heavy equipment. Matching GPS antennae with the dozer blade or excavator bucket allows for the tracking of earthwork in real time. In addition to the raw volume data, the GPS information allows for the recording of operator efficiency and equipment utilization—important data points for determining the unit cost of each cubic yard of earth. Earthwork productivity trends can be calculated and compared to the project schedule, allowing the contractor to adjust his fleet’s activities as needed to keep on schedule. Furthermore, the TIN files created from the original grading plan and site topographic maps can be downloaded into the equipment GPS system and use to guide their operations. GPS essentially eliminates the need for manual grid staking and the placement of elevation cones to guide earthmoving operations. Not only does GPS work for individual pieces of equipment, it can also be used to orchestrate and choreograph the movements of the site’s entire equipment fleet. This provides additional cost savings from overall efficiency of movement, with an increase of productivity approaching 50% over manual planning and operational control.
While working at maximum efficiency, the grades and elevations being creating by cut and fill operations can be tracked and checked in real time. No need to wait for the surveyors to come out and perform a physical check. Armed with these tools, a heavy equipment operator can assume greater responsibility and show more initiative than if he had to passively wait for grade checks. This encourages better morale and job satisfaction among the contractor’s crew members. This close coordination provided by the GPS and the surface TIN files also improves site safety.

Topcon Positioning Systems provides earthworks haul planning software with the MAGNET Project module that creates earthworks estimates and quantifications, which can be input into a greater site plan. Optimized haul routes are automatically generated giving operators the most efficient method of transferring different types of cut and fill materials throughout the job site. For scheduling, the software delivers detailed scheduling methods enabling projects to stay on track and on budget, as well as the proper tools to help plan the right times, detours, and routes to minimize construction-related traffic.
Trimble Geomatics & Engineering provides Business Center – HCE to fulfill the needs of Takeoff.
2D Takeoff: An estimated 60% plus of the work to create an accurate takeoff for civil projects is done in 2D from paper or PDF plan-sets. Contractors state that takeoff from a digital model or the need to create a 3D model in order to create an estimate is unnecessary. Many contractors do not realize that they can create and carry out 2D takeoffs in Trimble Business Center quickly and easily.
3D Takeoff: The remaining portion of a civil takeoff needs to be executed in 3D in order for accurate earthworks quantities to be computed. This process is a two-part process. The first step is to take the CAD or PDF data for the project and create 3D elevated objects from the data provided. This data is then added to a surface model that represents the existing terrain or the finished design model. The information from the plans relating to topsoil strip, topsoil replacement, geological strata from boreholes provides an indication of the number of different materials native to the project (rock, sand, gravel, clay, soil etc.) that will be moved in order to create the design surface. The user can then input the site improvement information (the layers [with depths] of select/purchased materials) that form the building pads, road beds, sidewalks, parking lots, cycleways, etc., on that fill area of the finished grade model for the project—this will subgrade adjust the finished grade model to formation level in order to compute accurate earthworks quantities. In addition, the user can enter over-excavation parameters beneath structures and buildings so that over excavation quantities and backfill materials can be accurately computed. Running the Earthworks Report is easy, and it can also be subdivided into Areas of Interest to break out the quantities into construction process areas or phases.
Utility Takeoff: With the Utilities Module, all of your underground and above ground utility information can also be computed including all of your pipes, cables, culverts, manholes, headwalls, fittings, and structures, What’s more, all of your trench quantities can also be computed, complete with backfill materials. The trench models are field ready and can be used directly with Earthworks Automatic Excavators for maximum job site productivity.
Mass Haul Computations: Now that you have the earthworks quantities, you know where all of the materials on site will be stripped, cut, filled, over excavated, backfilled etc. You will know the balance of materials for the project and whether you have an excess (waste material), a shortage (need to borrow material), or a balance (factoring for material shrink and swell properties). You can now rebalance the site, if you have the scope to do so on the project, and come up with a cost mitigation plan as a part of your bid process to minimize the cost impacts for the client because of material shortage or excess on the project. In addition, you can use the Mass Haul computations to determine the most cost-effective means of moving the dirt on the project. The optimization routines compute the most cost-effective (based on excavation, collection, haulage, and dispersion costs in association with waste and borrow costs) method to move the dirt on site. Contractors can save cost overruns through better planning of earthmoving operations, factoring in all of their haulage distances in a single computation. This data can be provided along with the earthworks quantities to determine the appropriate methods for material movement (dozer, scraper, truck/shovel, loader) and can be combined with known equipment production rates and costs to determine the labor and equipment costs for the estimate.
Trimble’s key strength is the connection of the bid-construct processes and office-field-office workflows. The Connected Site provides the web-based connectivity from office to field to office, providing rapid mobilization of equipment and site personnel, elimination of drive time to deliver data models to site, automated capturing of field-measured information, and the ability to see in real time what is happening on the project as well as providing the ability to support, troubleshoot, and train field staff remotely.