Formulas and methods for determining the volumes and areas of regular shapes and surfaces go back at least as far as ancient Greece. Pythagoras and other mathematicians determined those formulas that are still used to calculate the volumes of spheres and pyramids, as well as the areas of curve conic sections. But what was a matter of mystic philosophy to the Greeks is a matter of financial life or death for earthwork contractors. This is not an overstatement. An accurate estimate of the earthwork volumes and areas is essential for a contractor to both submit an accurate bid that has the potential to win a contract and to properly manage the resources assigned to the project so that he shows a profit. Since there is an inherent error in any estimating earthwork calculation, the contractor must properly manage the resultant unknowns to ensure the success of the project.
Sources of Measurement Error—The Map is Not the Terrain
“The more accurate the map, the more it resembles the territory. The most accurate map possible would be the territory, and thus would be perfectly accurate and perfectly useless.” – Neil Gaiman
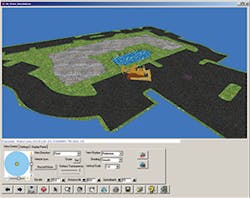
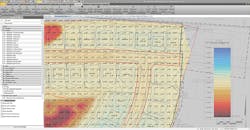
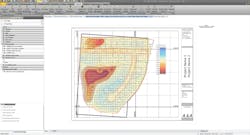
3D view rendered by Timble Software
Nothing is 100% accurate. No measurement, no map, no plan, no diagram. Nor should it be. These are used only in relation to how well they approximate the real terrain or structure that they represent. Knowing this to be true, however, we must take into account the effects of this inherent imperfection of measurements derived from the map. And to do that, we have to understand the sources of potential error and minimize as much as possible, while still having a useful model of the site in question.
What are the sources of measurement error? Begin with the initial survey itself. There are three broad categories of initial surveyor error: instrumental, personal, and natural. Instrumentation error results from actual imperfection in the manufacture of the surveying instrument itself, or from the surveyor’s initial adjustment when setting up the instrument. Even simple surveying tools like measuring tapes can be affected by ambient temperatures, resulting in a tape that is either longer or shorter than it should be. Personal error arises from the fact that the surveyor is only human. Human sight and memory are both imperfect, which can lead to misreading or mistaken recording of field measurements. As mentioned above, heat can affect measurement, and this is only one source of natural error. Others sources of natural error include humidity, gravity, wind, refraction, the curvature of a site alignment, and magnetic declination, all of which can affect survey instrumentation.
But even before the occurrence of errors in field measurement, the very basis of the survey may be faulty. These are the previously established benchmarks that anchor the entire site survey to local topographic data and the real world itself. All benchmarks located near the site need to be checked prior to a survey for accuracy and validity. Ideally, three each “third order” (those with the highest established accuracy) should serve as the basis of the ground survey, but at least one such benchmark is a necessity. If there is no other option, a survey can rely upon a “relative benchmark” such as a building corner or manhole lid. Assigning an arbitrary elevation such as 100 feet to such a point can allow for the measurement of elevations relative to this makeshift benchmark. But this ad hoc approach is inherently less accurate and should never be used for critical site surveys.
Validating benchmarks can either require a regional survey to link each benchmark to known points, or a thorough records search of previous property surveys and benchmark certifications. This records search is vital and should actually be the first step performed in any site survey. A thorough records search will also uncover information concerning past site activities that may have altered the existing surface since the last former survey, the existence and location of buried utilities that can interfere with the planned earthwork operations, and hydrogeological boring logs that define the soil strata and groundwater elevations under the site surface. The locations and elevations of each wellhead should also be recorded, allowing for further checking of survey accuracy. Other site surveys may delineate special areas of impact such as karst topography or protected wetlands.
Even the most diligent records search is worthless without boots on the ground performing onsite physical walk-overs before the surveying begins. There is simply no substitute for good old-fashioned, eyes-on physical reconnaissance of a site. A multitude of site details from new vegetation, recent site-changing activists, and areas of erosion will not appear on even the most recent site survey or be described in the most recent site record. So even in the age of LIDAR and AutoCAD, there is no substitute for human observation.
Estimators also need to take into account the effects of the earthwork activity itself on the soil volumes. There are actually three types of soil volumes: bank volumes, loose volumes, and compacted volumes. Bank volumes are measurements of soil quantities already in the ground. These are the direct measurements between existing grades and proposed excavation grades. Loose volumes are the volumes of soil that haven’t been disturbed during excavation and removal and are placed in the back of dump trucks or in stockpiles in a loose condition. Typically, a 25% increase (called a “swell factor”) is assumed for most types of soil to reflect the increase in overall soil volume as a result of disturbance during excavation. Therefore, 1 cubic yard of natural in-place soil becomes 1.25 cubic yards in a stockpile or back of a dump truck. If this loose soil is reused onsite, it will be compacted in place to make stable structural fill or low-permeability compact soil liners. The usual rule of thumb, when placing and compacting soil, is to initially spread it in loose lifts of 8 inches thick and then compact it in place to tight lifts of 6 inches in thickness. The resultant compacted volume is therefore only 75% of the loose placement volume, and so the 1.25 cubic yards of loose soil becomes 0.94 cubic yards of compacted soil—a final 6% reduction over the initial natural in-place volume. This may not seem important, but it can be a significant and costly error on large earthwork projects.
Aerial topography, as distinct from ground surveys, has its own sources of potential error. All aerial imagery is subject to geometric distortion since it does not provide a top-down view, but rather an oblique view which is the result of camera height, curvature of the earth, or uncompensated movement of the aerial platform. The result is relief displacement where buildings and other large objects may not be accurately seen on the topographic map. And even the most accurate aerial topographic map is accurate to only one-half of the map’s smallest contour interval. So, a map showing 1-foot elevation contour intervals would have elevation accuracy of only plus or minus 0.5 feet.
Survey mistakes can be cumulative and cannot be completely avoided. Nothing is 100% accurate, nor does it need to be, provided that the number and extent of survey errors are strictly minimized. For example, a series of only three measurements that are merely 10% inaccurate would reduce the overall accuracy of the element being surveyed to less than 75%. Even when mistakes are minimized or avoided the result is still an interpolation—not reality. Some best guesses are better than others and at the end of the day, the most an estimator can hope for is the best guess possible.
This is mostly because precision and accuracy are not the same thing. Assuming they are similar is a common mistake made by even experienced earthwork operatives. Precision is defined as the number of units that are used to describe a value (a measurement that is recorded to one-thousandth of a foot is more precise than one only one-tenth of a foot). Accuracy, on the other hand, is defined as how close a measurement is to the real value of the characteristic being measured. Estimators should focus on achieving high degrees of accuracy while keeping in mind all of those factors that make 100% accuracy impossible to achieve in the real world.
So how to best resolve these issues of accuracy and completeness? According to Alan Sharp of Trimble, “When it comes to estimating earthworks volumes, customers are looking for: 1) The ability to integrate data from many sources—design systems, paper plans, PDF files, machine data, drone data, scanners, and surveying systems; 2) Smoother, simpler workflows and a holistic approach to all of the connected processes around a common 3D constructible model; 3) Constructible models that they can build using automated techniques—no matter what they are doing—compacting, paving, grading, trenching, drilling and blasting, etc.; 4) Smarter reporting with all the data they need in simple, easy-to-read reports; 5) Presentation tools that allow the process and bid to be supported with clear schedules and well-documented work plans that they can use to successfully win more bids; 6) Constructible models to track and monitor project progress, improve KPIs, and optimize construction workflows; 7) Remote visibility to projects as they happen; 8) An ongoing and evolutionary process through the takeoff, estimate, bid, schedule, operate/execute, as built, handoff process; and 9) The ability to use the information learned on one project on successive projects to sharpen bids with greater certainty and lower project risk.”
Measurement of Areas—Flat Areas vs. Sloped Areas
Triangular Area Method. The proposed earthworks area must be defined by a boundary. The boundary will encompass all areas of excavation and fill. The result is a regular (square, rectangle, etc.) or irregular polygon. But even the most irregular polygon can be broken down into an arrangement of individual triangles of differing areas, side lengths, and corner angles. Knowing the location (northing and easting) of each triangle corner, the estimator can then calculate the area of the individual triangles. The total flat plane area of the site can then be calculated by adding the sum of all of the individual triangles. The Triangle Area Method is
calculated as follows:
A = sqrt[s * (s – a) * (s – b) * (s – c)]
Where:
- A = the area of the triangular area (square feet)
- a, b, c, = the lengths of the three sides of the triangle (feet)
- s = (a + b + c) / 2
Length Interval Method. The Length Interval Method is best used for areas with flat slopes or slopes with consistent, regular grades, but that have highly irregular boundary limits. Intervals are set perpendicular to a baseline that has been aligned as needed to calculate the area as accurately as possible. The lengths of each interval extend from where the interval crosses one side of the area boundary to where it crosses the opposite side of the boundary. The Length Interval Method is calculated as follows:
A = D * ((L1 + L2) / 2)
Where:
- A = area (square feet)
- L = lengths of the adjacent intervals (feet)
- D = distance between intervals along the baseline (feet)
Measurement of Volumes—Sandwiched Between Two Surfaces
So how do estimators calculate the volume between two surfaces? This can be a very complicated process since the amount that the elevation of the soil surface changes can vary considerably and irregularly across the site. The first surface is typically the existing site topography, while the second shows the post-construction site grades. Post construction grades can result from excavation (cut) of existing soil, by the placement (fill) of additional soil, or by some combination of the two. The volumes required to place soil are typically designated as positive volume while those volumes resulting from excavation are treated as negative volumes. The resultant numbers can be added together to get a cut-to-fill balance for the site. A well-designed site will (if possible) result in a balanced cut to fill with the net volume of the two equaling zero. Depending on the nature of the site and its proposed earthwork, there are several options available for accurately estimating the resulting earthwork volumes.
The Depth Area Method. Sites with a consistent thickness of cut to fill can have their volumes estimated by means of a simple Depth Area Method calculation. This approach multiplies the surface area of the site by the thickness of the proposed earthwork. Typical examples of this include cuts or fill to grade to establish a base for subsequent pavement installation, filling a pre-existing foundation hole with a flat bottom, stripping topsoil to a consistent depth like 6 inches, or trenching at a consistent width and depth below surface grades along the length of a proposed buried pipeline. The existing surface itself does not have to be flat (though that would increase the accuracy of the estimate) so long as the resultant surface parallels the slopes and elevations of the existing surface. But when calculating for a significantly sloped area, the effects of sloping must be accounted for. For example, a site with a plane area—looking down directly from above as in a map or plan view—may have an area of 1,000,000 square feet (a square measuring 1,000 feet by 1,000 feet). However, if this area is not flat but instead has a 25% slope grade (1 vertical to 4 horizontal) in one direction, then its actual dimensions are approximately 1,031 feet by 1,000 feet, resulting in an actual surface area of 1,031,000 square feet. This may seem small, but on large projects, such a percentage difference can result in significant changes in the overall volume estimate that can further result in significant amounts of money being spent over and above the initial cost estimate. The Depth Area Method is calculated as follows:
V = T * A * (1/27)
Where:
- V = volume (cubic yards)
- A = surficial slope area (square feet)
- T = thickness of strata or even cut (feet)
The Grid Method. The Grid Method is normally used to estimate volumes excavated from borrow pits (and is often referred to as the Borrow Pit method). Like the Depth Area Method, the Grid Method utilizes thickness measurements over a given area. However, the thicknesses can vary across the site, and the areas in question are a series of grid locations placed at consistent intervals oriented to a particular alignment (north-south, property line, roadway alignment, etc.). Each grid point is treated as the center of a square whose sides are equal to that of the grid interval (for example, 10 feet by 10 feet for grids set at 10 feet by 10 feet intervals). The surface slope within the grid square itself is accounted for and approximated by assigning surveyed or proposed elevations to each of the square’s corner points. The square is treated as a column that goes directly down (or up) vertically through the proposed soil excavation (or fill placement) where the four corners align with matching corners located on the proposed surface. Measurements can then be taken to determine the depth of cut or fill at each corner (again keeping cut distances negative and fill distances positive).
The four depths are then averaged by adding them and dividing by four. This gives the averaged depth for the grid square, which can then simply be multiplied by the area of the square to determine the volume of the dirt column at that given grid point. Needless to say, accuracy can be increased by reducing the grid intervals and using ever smaller squares. However, the number of resultant squares as a square of the interval reduction (reducing the interval by half increases the number of squares that have to be calculated by a factor of four, reducing the interval to a third, increases the number of squares by a factor of nine, etc.). The Grid Area Method is calculated as follows:
V = ((D1 + D2 + D3 + D4) / 4) * A * (1/27)
Where:
- V = volume (cubic yards)
- A = area of the grid square
(square feet) - D = depth of cut/fill at each grid
corner (feet)
The End Area Method. Instead of calculating volumes from top down from an existing surface to a proposed surface, the End Area Method calculates volumes by means of vertical slices cut at regular intervals through the fill or cut spaces. The slices are aligned perpendicular to a baseline running the full length of the earthwork area. This is usually the site’s longest dimension to increase accuracy, but can also be aligned along a property or tract line, utility easement, right of way, roadway centerline, etc. The interval between the parallel slices can vary depending on the size of the site and the designed accuracy of the calculation. The volume of a massive 1,000-acre site development could be calculated with reasonable accuracy with intervals of 100 to 200 feet. A smaller square building lot of fewer than 10 acres (660 feet by 660 feet) would not achieve reasonable accuracy with such a large interval as it would only utilize six slices. In general, the smaller the site, the smaller the required interval between slices.
Though these slices could be drawn (and have been drawn in the past) manually, the easiest way to draw these slices is with an AutoCAD program that generates cross sections and then determines the area of each slice. Note that sometimes there is an exaggerated vertical dimension for sake of visual clarity of the drawing. Often this is five or 10 times more than the horizontal dimension (for example, horizontal 1 inch equals 100 feet vs. vertical 1 inch equals 20 feet would result in five times vertical exaggeration of the drawing. Care must be taken to ensure that the resultant calculation of the slice areas takes this exaggeration into account and does not just directly measure the area on the drawing, and so avoid exaggerating the slice area by a factor of five. As always, cut areas are negative and fill areas are positive. Cross section areas can be determined by hand but are usually calculated by the AutoCAD program, either by means of the Triangular Area Method if the cross sections are simple and regular, or by the Length Interval Method if the cross-sectional shape is irregular and complicated. The End Area Method is calculated as follows:
V = L * ((A1 + A2) / 2) * (1/27)
Where:
- V = volume (cubic yards)
- A = areas of the adjacent cross
sections (square feet) - L = distance between cross section along the baseline (feet)
The Prismoidal Formula. The Prismoidal Formula is a refinement of the End Area Method and is often necessary if the existing ground surface is highly irregular in the area strips between adjacent slice intervals. With this method, the estimator adds an additional cross section halfway between the two cross sections bounding the irregular surface (note that this method does not have to be done for every interval across the site—only for those with localized irregularities). The area of this halfway cross-section is calculated separately and is not just an average of the two adjacent cross sections. The Prismoidal Formula is calculated as follows:
V = L * ((A1 + (4 * Am) + A2) / 6) * (1/27)
Where:
- V = volume (cubic yards)
- A1, A2 = areas of the adjacent cross sections (square feet)
- Am = area of the midway cross section (square feet)
- L = distance between cross section along the baseline (feet)
The Contour Area Method. The Contour Area Method utilizes the contour elevation lines drawn on the site’s topographic map and the grade lines drawn on the proposed site plan to calculate the site’s cut and fill volumes. This method is in many ways an easier way to calculate volumes compared to the End Area Method since there is no need for additional drawings and cross-sections. Traditionally, measuring the areas enclosed by contour elevation lines was performed by hand with a planimeter attached to the draftsman’s design board. The volumes are calculated by averaging the area of adjacent contour elevations and multiplying the average by the elevation difference (a method nearly identical to that of the End Area Method—only the orientation of the areas is horizontal instead of vertical). The Contour Area Method is calculated as follows:
V = H * ((A1 + A2) / 2) * (1/27)
Where:
- V = volume (cubic yards)
- A = areas of the adjacent elevation contours (square feet)
- H = elevation difference between contours (feet)
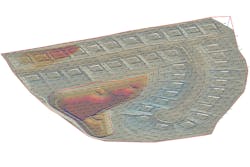
The Triangulated Irregular Network (TIN) and Digital Terrain Model (DTM) Methods. The Triangulated Irregular Network method utilizes files created by AutoCAD (“.tin” files) on topographic surfaces to determine volumes. These surfaces consist of triangles created by the software from field survey points which it graphically connects to other nearby points (in terms of horizontal distance, not elevation difference) to form a series of irregular triangles that cover the surface like the facets on the face of a jewel. This, in turn, allows for the creation of highly accurate Digital Terrain Models. Given the huge number of calculations required, this is a process that can only be done on a computer. The DTMs allow for direct calculation between a surface and a fixed elevation or two such surfaces. DTMs can also be generated for different soil strata in an excavation, allowing for direct calculation of volumes for each soil type.
Measurement Software and Systems—Major Suppliers
Roctek International produces WinEx-GRADE and WinEx Master software that estimates cut and fill quantities using a high-density grid method. They offer several features unique to their product line such as Vector Direct, LineTracker, and Alternate Plan. The Vector Direct import utility can virtually eliminate tracing from Vector PDF and CAD files by importing both the lines and the elevations. LineTracker greatly increases the efficiency of tracing by locating and snapping to the closest line. This allows the user to draw faster without losing precision even through overlapping lines and callouts. Alternate Plan allows for the use of unlimited pages with differing scales within a single takeoff. Their professional analytics and visualization tools allow the operator to inspect the entire site plan in 3D, while point and click elevation shows you exactly what is happening at any point. Additional specialized functions include: export to GPS, sub-grade quantities for any work area, over-excavation routines, retaining walls, lone and connected spot routines, topsoil strip and re-spread routines, strata layer information from bore logs, cross section slices at any angle, advanced trench routines for underground utilities, and advanced site balancing options. Roctek stays on the cutting edge of technology with frequent, user-driven updates and offers unrivaled customer service by providing knowledgeable technical support to users of all experience levels. As one customer noted: “Roctek’s WinEx Master software is built to satisfy ALL cut and fill needs. This is a powerful tool with superior reporting, digitizing, and visualization tools. With so many features, it will not be something you can learn overnight, but the customer service outstanding! They would stay on screen with you all night if you needed to learn it fast.”
Vertigraph, Inc. provides BidScreen XL as an add-in software that documents the quantity takeoff in Microsoft Excel. Bidscreen XL is ideal for any trade. The combination provides both flexibility and simplicity. When BidScreen XL is downloaded, the entire takeoff process of measuring and calculating quantities is performed directly by Microsoft Excel with everything saved with the Excel workbook. It works with the top vector and raster file types such as PDF, DWG, DXF, TIFF, etc. The functions and formulas placed in the Excel spreadsheet will calculate quantities and estimate bid pricing from the BidScreen XL measurements. An associated program, SiteWorx/OS (more applicable to excavation contractors than the BidScreen XL application) creates surface models and calculates site excavation quantities.
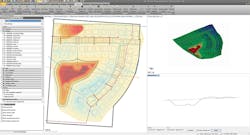
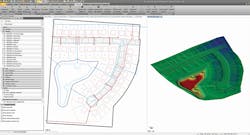
According to Sharp, their advancements in estimating and bidding can be seen in their takeoff software like Trimble’s Business Center, HCE, which is being used to digitize and model data from paper plans, raster PDF files, vector PDF files, or CAD files. Their software can apply all of the construction details included in construction documents and specifications—including boreholes, strata layers, demolition areas, utility trenches and utility details, and material and site improvement depths for pads, parking, and road landscaping—to build out a detailed estimate of quantities for the project.
Once the quantities are determined, the models and quantity locations can be converted into a work process assessment to determine how the project will be executed, when each step will be executed, how long each step will take, and what equipment and personnel will be required. The software can then analyze the flow of materials around the project and can be used to determine the optimal way to excavate or place the soil. The optimization can include equipment type and quantity, including associated operating costs like fuel, operators, maintenance, and time as well as mobilization costs. For example, the mass haul functionality in Business Center–HCE provides advanced methods to determine the optimal processes at the lowest cost of construction. These results can then be combined into the contractor’s estimating suite to carry out detailed estimating with the knowledge that the best practice and optimal quantities have been assessed.
These details can then be combined into scheduling software, which can convert quantities and haul distances with production rates and assigned resources to create a time-location schedule. Trimble TILOS is an improvement on traditional scheduling processes based on GANTT chart technology, where an activity list can be provided with a start, end, and duration, but not with where on the project and in which direction you are working. Traditional GANTT chart users cannot apply seasonality or environmental constraints reliably. They also cannot see the impact of clashing operations, because traditional scheduling solutions do not contain the geospatial elements required to see what is happening, where, when, and with what resources. TILOS, however, brings all of these elements together and can present schedule information in both traditional ways as well as in a time-location diagram. This Time Location diagram can present on a single page all of the information typically included on a GANTT chart. The time-location diagram can also be used to present progress of activities on a project. The TILOS system integrates with Business Center-HCE mass haul, allowing project estimates to be scheduled automatically into a time-location diagram.
Once the bid is won, the contractor moves into the operational phase. Traditionally, more detailed models are created at this stage, and the estimating model is usually discarded. Using Trimble technology, the estimating model is simply reopened and improved as necessary and can be more rapidly deployed to guide construction operations because of the seamless connection to field systems for surveying, site positioning, grade checking, and machine control. A single constructible model can mobilize the most complex projects rapidly, linking to Trimble or third-party and OEM systems. Bringing estimating teams and operational execution teams closer together using common tools is extremely important to be competitive on construction bids.